Interface
Main Window
Subwindows
NumbatUI's three views are organized into subwindows, which can be freely arranged within the Main Window or detached from it. Each subwindow has a title bar displaying its name and 2 buttons for closing the subwindow and for detaching it from the Main Window.

Interactions
- Drag the subwindow at the title bar to rearrange it within the Main Window, detach it or attach it again.
- Press the "x" icon to close the subwindow. They can be reopened from the View Menu.
- Press the "□" icon to detach the subwindow from the Main Window.
Tab Bar
The Tab Bar is located at the top of the Main Window and is used to open multiple symbols in parallel.

Interactions
- Click on the
+icon to open a new tab or use the New Tab Shortcut. - Click on a tab to activate it and show it's content or use the Next/Previous Tab Shortcuts.
- Click on the
xicon on the right of each tab to close it or use the Close Tab Shortcut. - Click and drag a tab to change it's position.
Status Bar
The Status Bar is located on the bottom of the Main Window and is used to convey information about NumbatUI's status and currently running processes to the user
It displays:
- The most recent status message.
- Error Count if the currently loaded project has errors.
- Indexing progress bar while indexing.

Interactions
- Click on the status message count to display the (Status Tab](#status-tab).
- Click on the error count to display the error locations in the Code View.
- Click on the indexing progress bar to display the Indexing Dialogs if they were hidden.
On-Screen Search Bar
The On-Screen Search Bar is used to search visible contents of the Graph View and Code View. It gets displayed at the bottom of the Main Window when using the Find On-Screen action.

Interactions
- Enter a search query to search in contents of the Graph View and Code View.
- Click the arrow buttons next to the search field to iterate the matched locations.
- Use the checkboxes right of the search field to define which view contents will be matched.
- Click the
xicon on the right to close the On-Screen Search Bar or pressESC.
Windows
Start Window
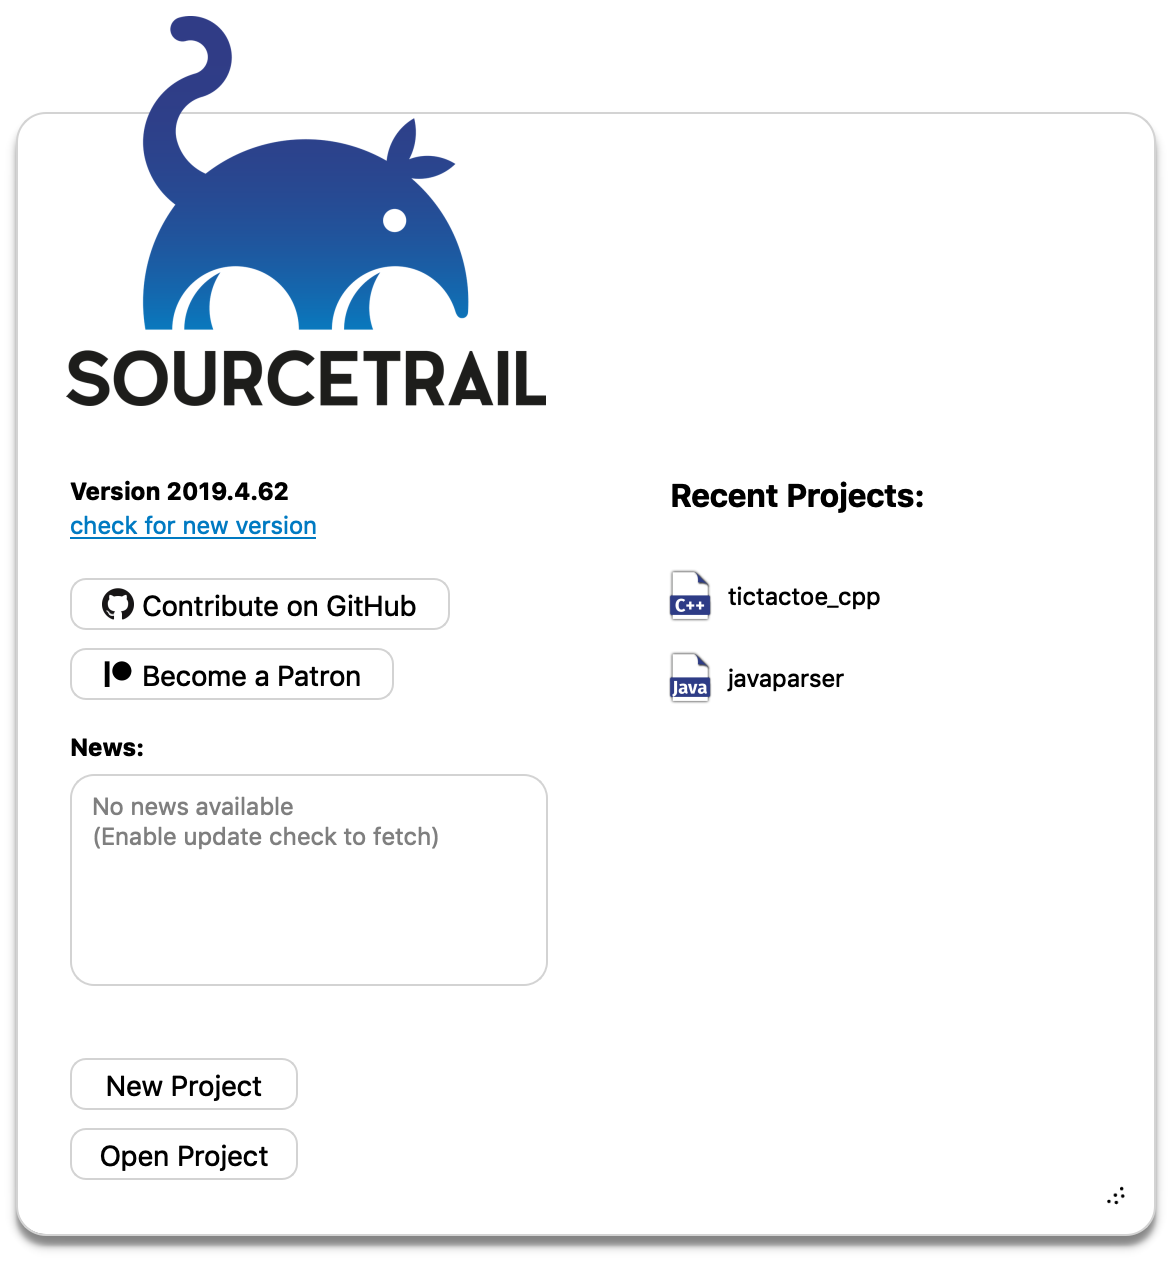
On every start of NumbatUI you are shown the start window. It allows for creating new projects or opening existing ones.
Interactions
- Clicking
New Projectwill lead you to Project Setup. - Clicking
Open Projectwill let you open an existing NumbatUI project by choosing from a file dialog. - Clicking on one of the
Recent Projectswill open this project. The list shows a maximum of 7 items ordered by recent first. - Pressing
ESCwill close the window. - Click
Check for new versionto connect to https://sourcetrail.com and check if a new version is available.
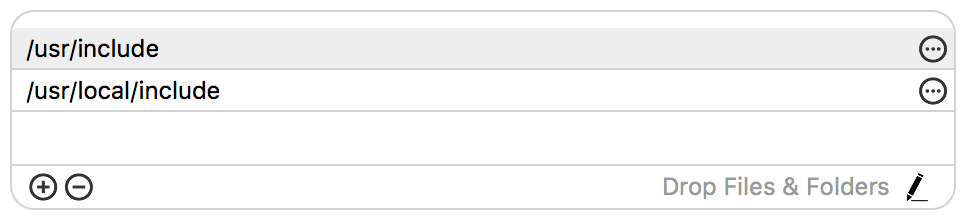
Path List Box
The Path List Box is a user interface element that is used within the Preferences Window and the Project Setup Wizard. It allows for entering a list of file and directory paths.
If you want to use environment variables you can use either of the following notations.
${VARIABLE_NAME} or %VARIABLE_NAME%
Interactions
- Click the "+" icon to add a new path line.
- Click the "-" icon to remove a selected path line.
- Click a path line to select it.
- Enter the path by typing on your keyboard
- Click "..." within the path line to open a file dialog for choosing a file or directory path.
- Directly add multiple paths into the box by dropping elements from your filesystem.
- Click the pen icon in the bottom right corner to edit the list as plain text.
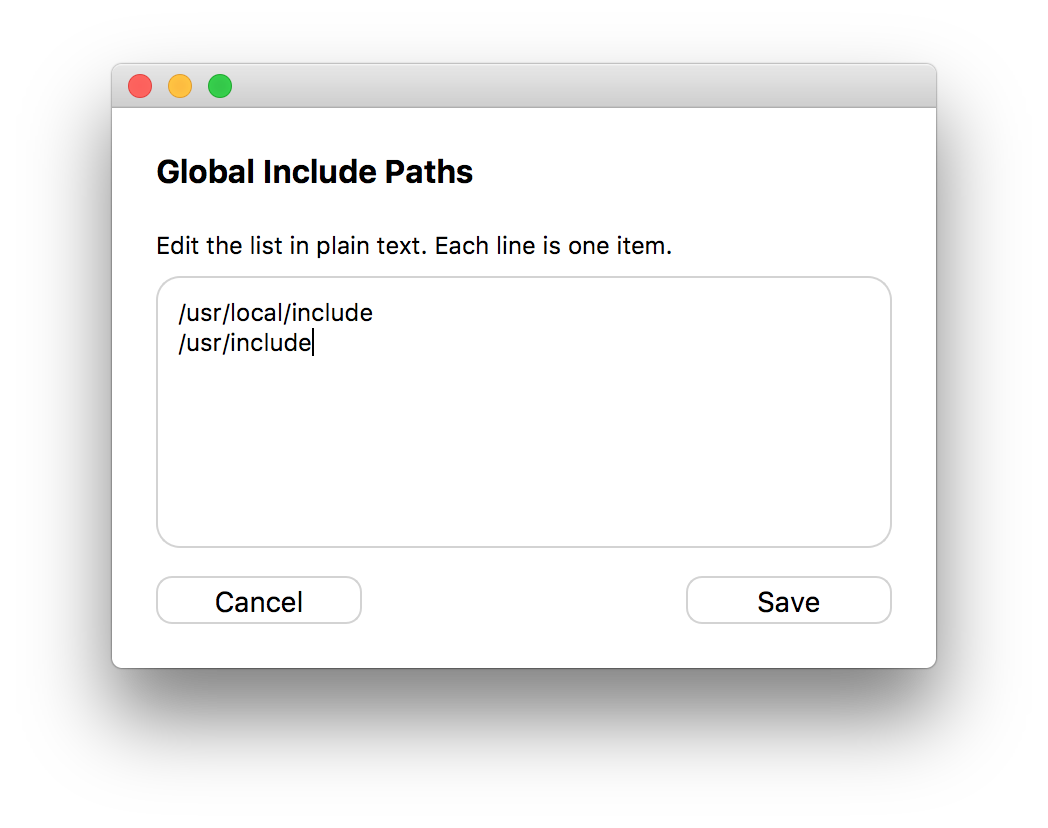
Plain Text Editing
By pressing the pen icon in the bottom right corner you can open the plain text edition dialog. It allows you to edit the whole list within a text field. Each line will be one list item.
Interactions
- Add and remove list items through keyboard interaction.
- Click
Cancelto cancel plain text editing. - Click
Saveto save your changes to the list.
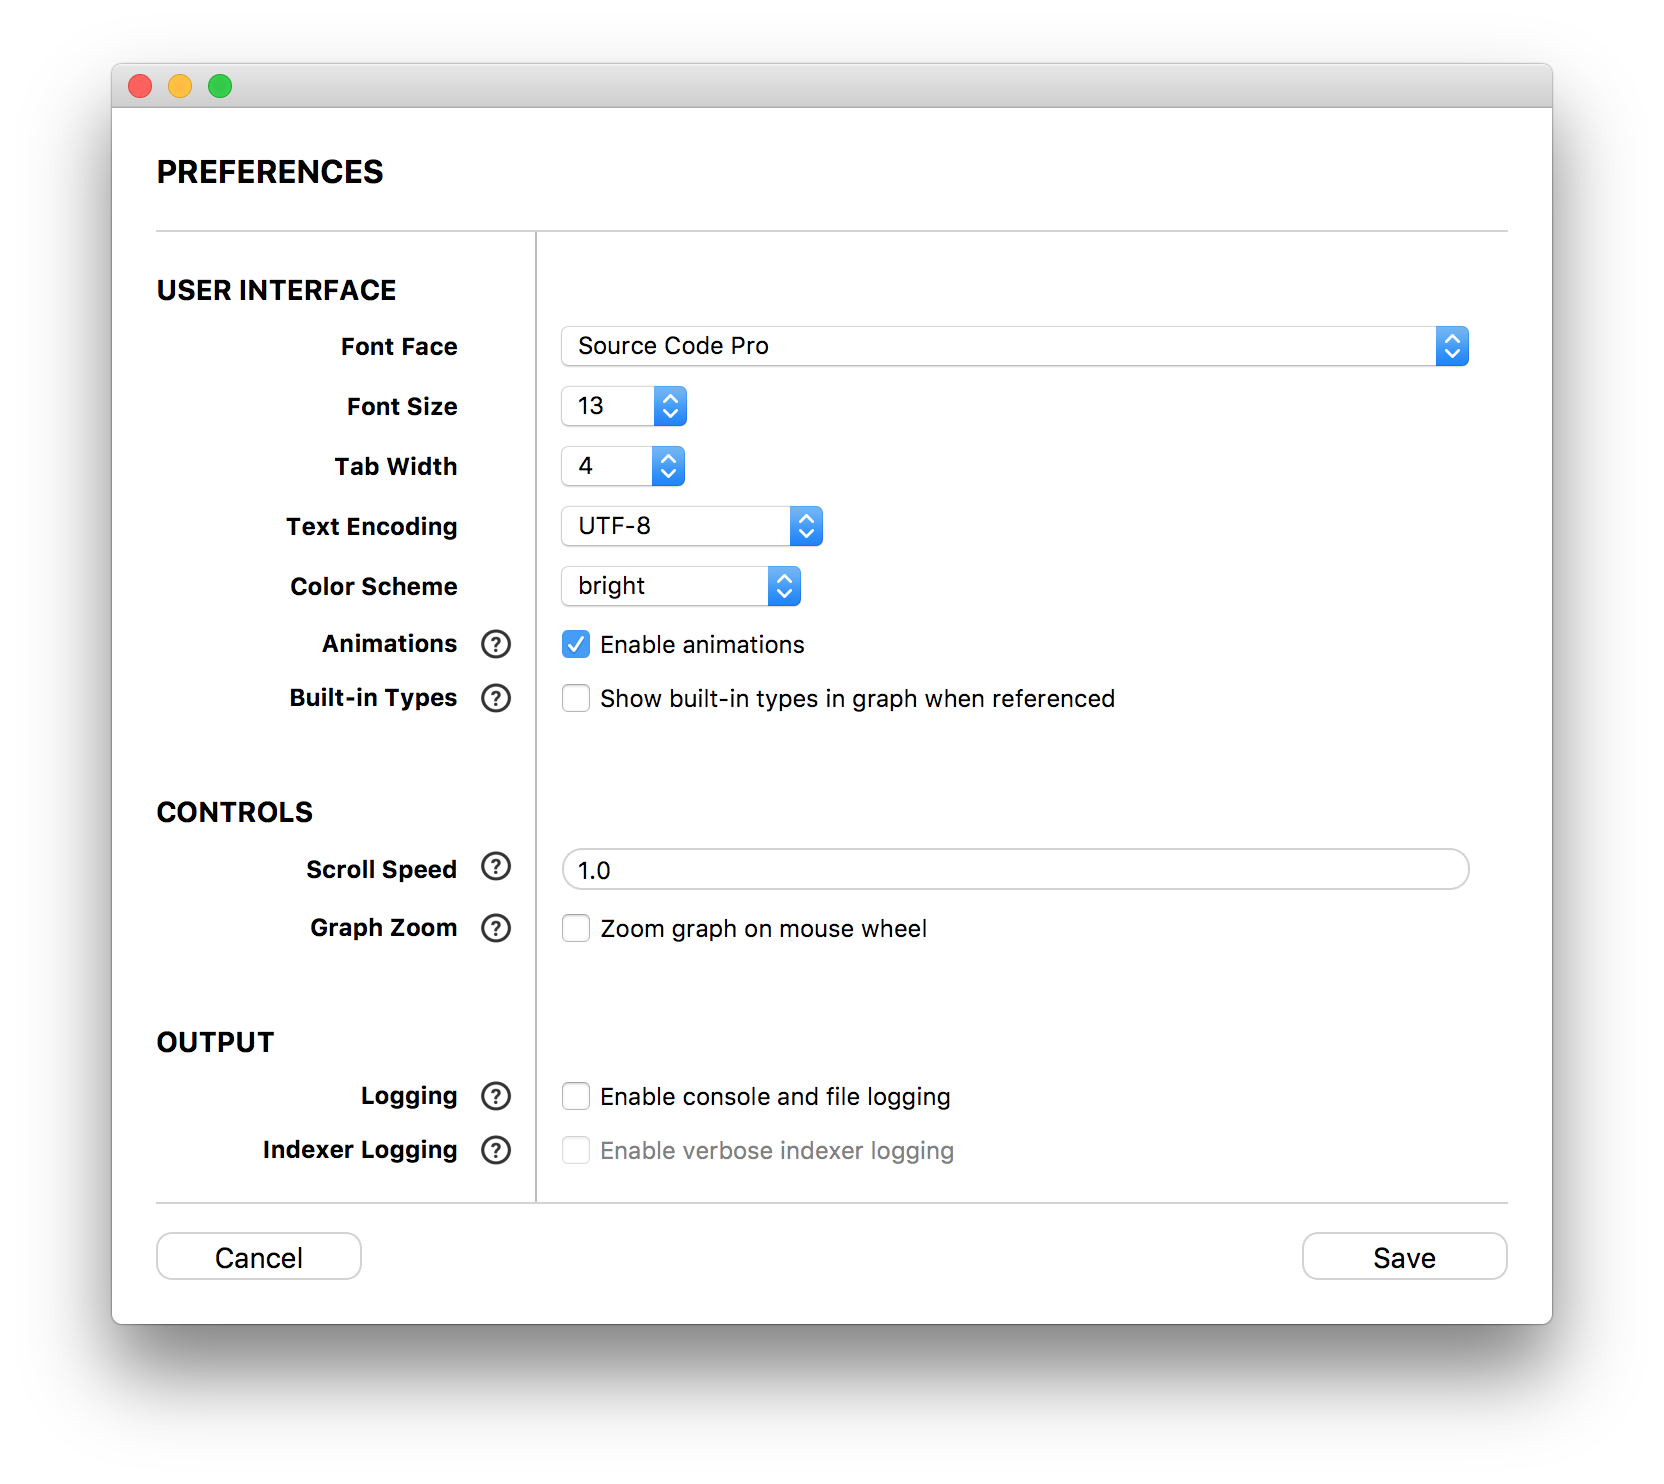
Preferences Window
The Preferences window lets you define settings for all projects. You can open the Preferences from the menu via Edit/Preferences.
| Setting | Description |
|---|---|
| Font Face | Define the font face used throughout the UI |
| Font Size | Set the font size used throughout the UI. It can also be changed with the actions in the View Menu |
| Tab Width | Define the space width of tabs in the code view. |
| Text Encoding | Define the Text Encoding used for displaying your source code. |
| Color scheme | Choose which color scheme NumbatUI should display. The color schemes are located in data/color_schemes/ |
| Animations | Define if animations are used within the user interface. |
| Built-In Types | Define whether built-in types such as int or bool are shown when referenced in the graph view. |
| Directory in File Title | Enable display of the parent directory of a code file relative to the project file. |
| Auto Scaling to DPI | (Linux only) Define if automatic scaling to screen DPI resolution is active. This setting manipulates the environment flag QT_AUTO_SCREEN_SCALE_FACTOR of the Qt framework. Choose 'system' to stick to the setting of your current environment. |
| Scale Factor | (Linux only) Define a screen scale factor for the user interface of the application. This setting manipulates the environment flag QT_SCALE_FACTOR of the Qt framework. Choose 'system' to stick to the setting of your current environment. |
| Scroll Speed | Define a multiplyer for the default scroll speed. Values smaller than 1 slow down scrolling while values greater than 1 increase the scroll speed. |
| Graph Zoom | Switch the default mouse wheel behavior in the graph between scrolling and zooming. |
| Logging | Ticking this box enables logging to console and to a log file. This option is disabled by default to speed up NumbatUI. If you encounter problems while running NumbatUI, we recommend to enable this option so you have somewhere to start looking for a cause. |
| Indexer Logging | When enabled NumbatUI will log detailed information during indexing. This log data can help us fix issues. |
| Automatic Update Check | Check to automatically check whether a new version of NumbatUI is available once every day. |
| NumbatUI Port | Port number that NumbatUI uses to listen for incoming messages from plugins. |
| Plugin Port | Port number that NumbatUI sends outgoing messages to. |
| Indexer threads | Define how many parallel threads are used during indexing. Setting this value to default will cause NumbatUI to detect the ideal number of threads based on the CPU and use as many threads for indexing. |
| Multi process C/C++ indexing | Enable C/C++ indexer threads to run in a different process. This prevents the application from crashing due to unforeseen exceptions while indexing. |
| Post Processing | Enable a post processing step to solve unsolved references after the indexing is done. These references will be marked "ambiguous" to indicate that some of these edges may never be encountered during runtime of the indexed code because the post processing only relies on symbol names and types. |
| Global Include Paths | Set header search paths that are used for all of your projects (e.g. std headers). An option for automatic detection of these paths is available for Clang, GCC and the Visual Studio compiler. For instructions on how to add paths manually see Path List Box. For instructions on how to find the system header paths see Finding System Header Locations. |
| Global Framework Search Paths | (macOS only) Define the search paths for .framework files for all of your projects. An option for automatic detection of these paths is available for Clang and GCC. For instructions on how to add paths see Path List Box. |
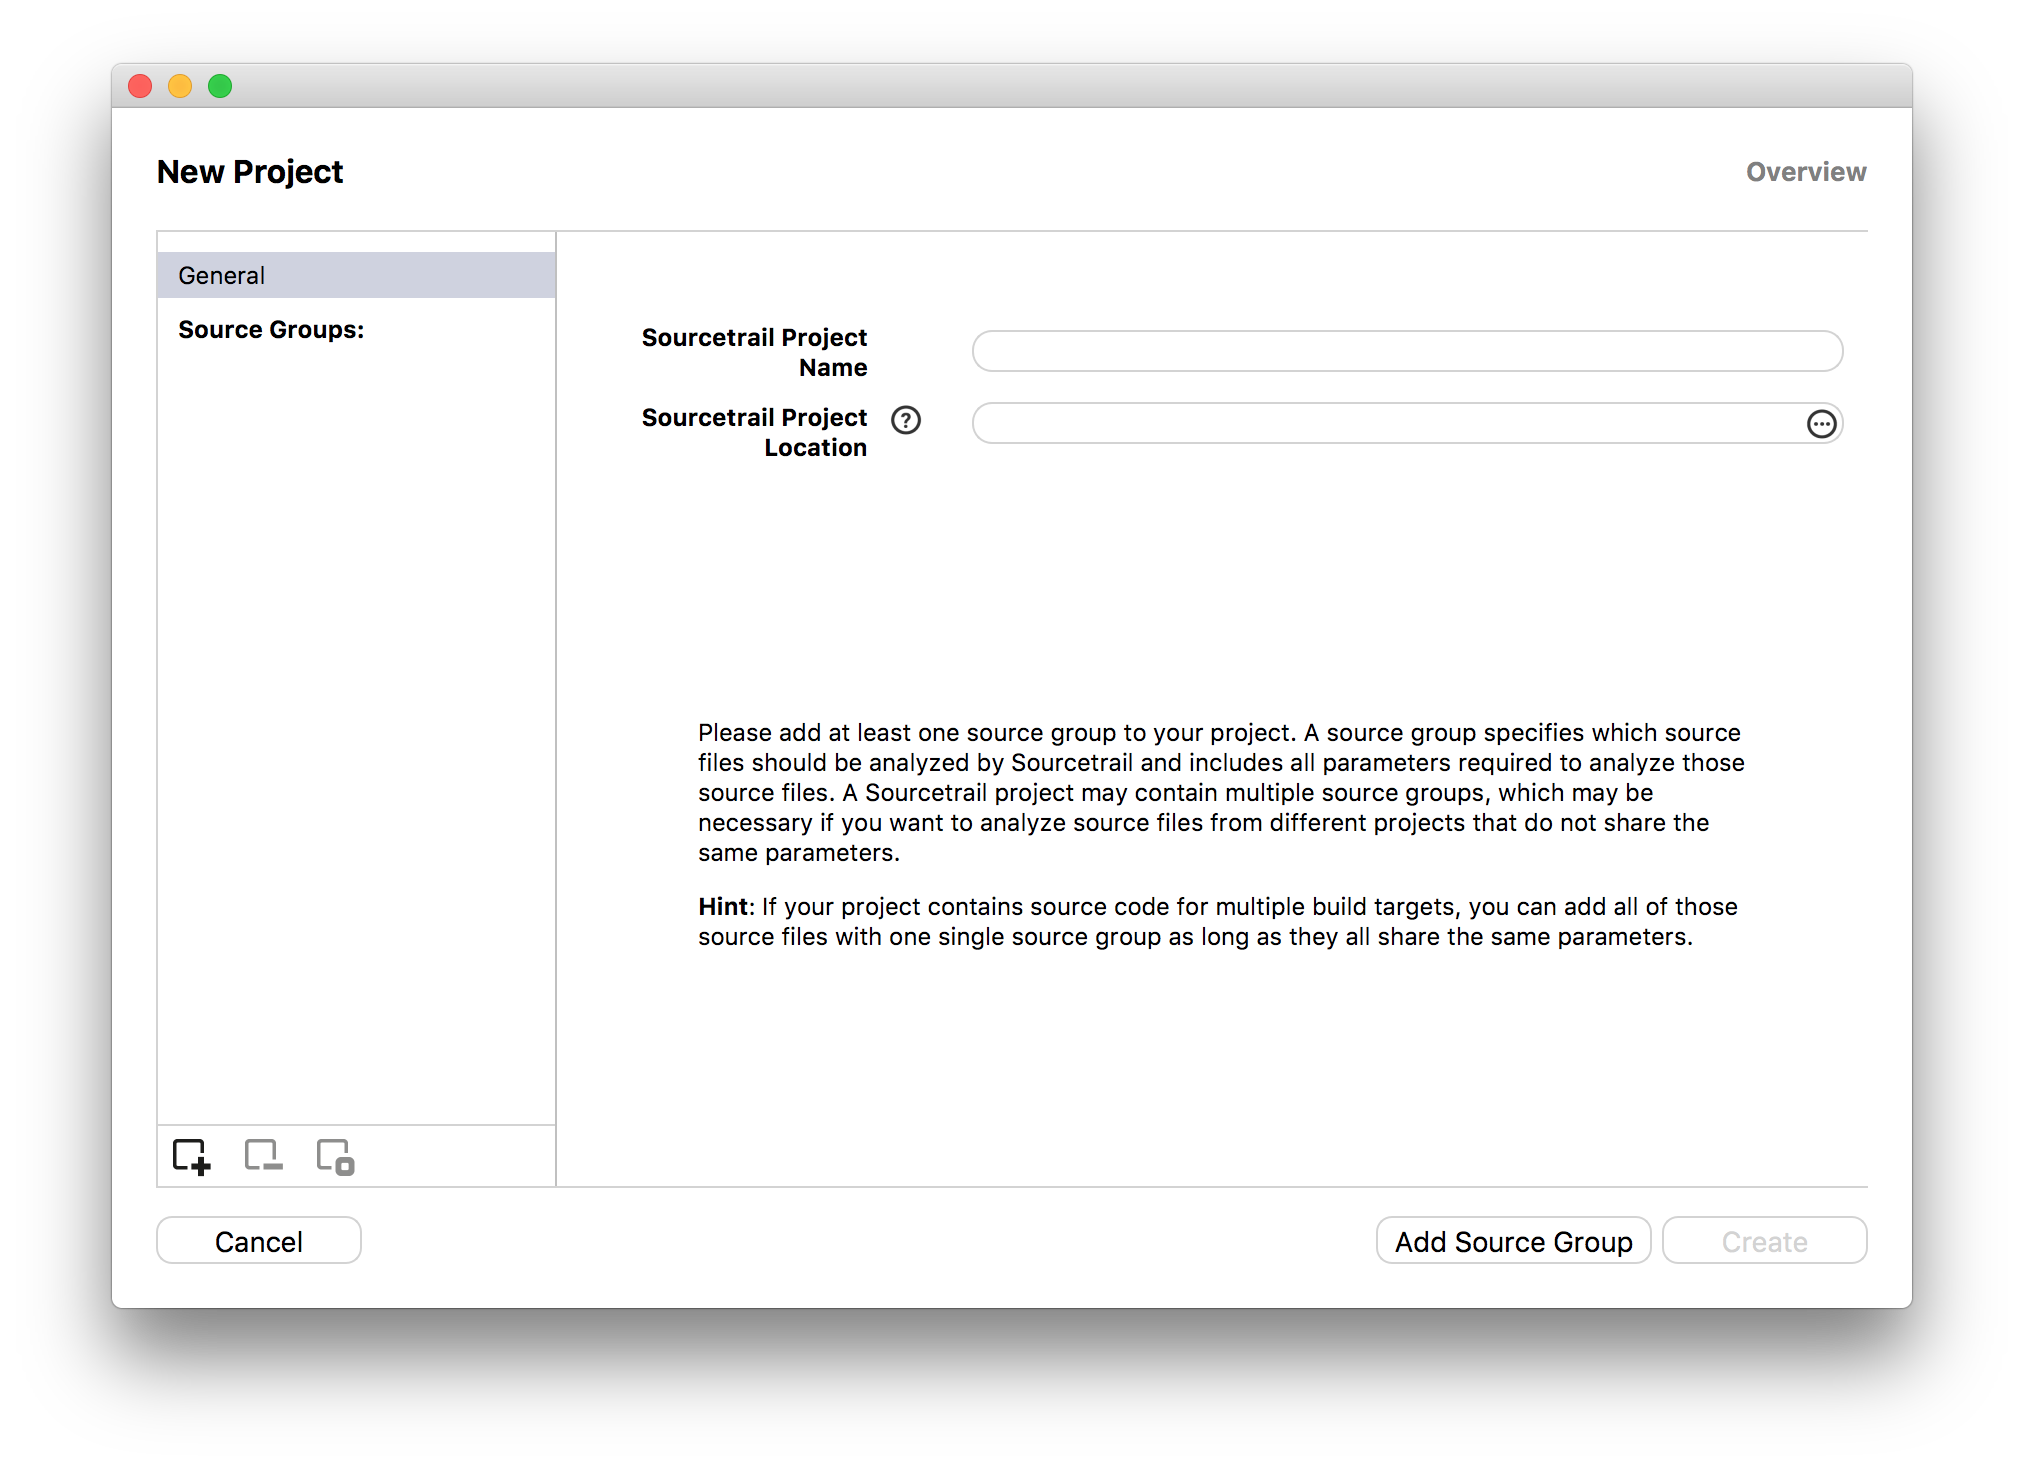
Project Setup Wizard
The Project Setup Wizard lets you create a new NumbatUI project. It allows for defining name and location of your project NumbatUI and adding several Source Groups, that define which source files will be indexed. There are several ways to create Source Groups. It is sufficient to add only one Source Group for most projects.
For detailed information continue at PROJECT SETUP.
Indexing Dialogs
These dialogs will be used while NumbatUI indexes your project. The whole user interface will be frozen as long as these dialogs are visible.
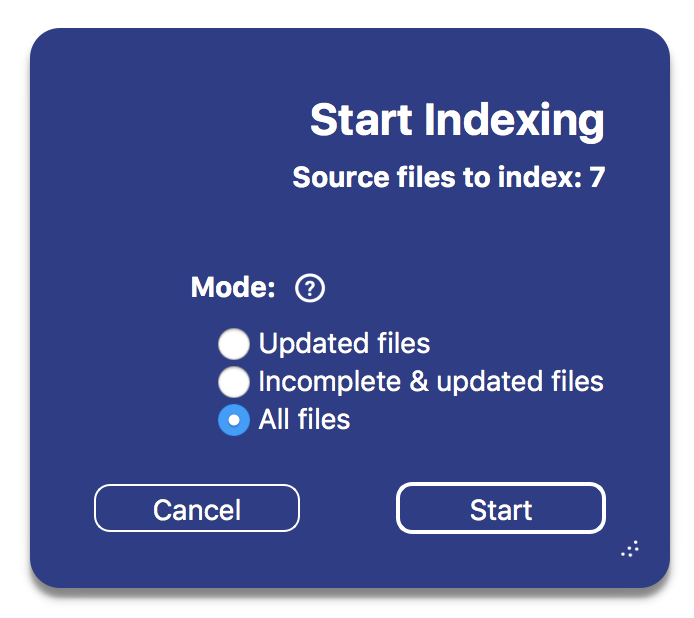
Start Indexing Dialog
This dialog displays the number of files for indexing and clearing before indexing starts. There are different refresh modes:
- Updated files: Reindexes all files that were modified since the last indexing, all files depending on those and new files.
- Incomplete & updated files: Reindexes all files that had errors during last indexing, all files depending on those and all updated files.
- All files: Deletes the previous index and reindexes all files.
Shallow Python Indexing
For Python projects a checkbox Shallow Python Indexing is additionally displayed. When checked, references within your code base (calls, usages, etc.) are resolved by name, which is imprecise but much faster than in-depth indexing. Use this option for a quick first indexing pass and start browsing the code base while running a second pass for in-depth indexing.
Interactions
- Switch indexing mode by clicking a different option.
- Clicking
Cancelwill abort indexing. - Clicking
Startwill start the file clearing and indexing.
Progress Dialog
This dialog shows that NumbatUI is currently doing processing that can't be interrupted.
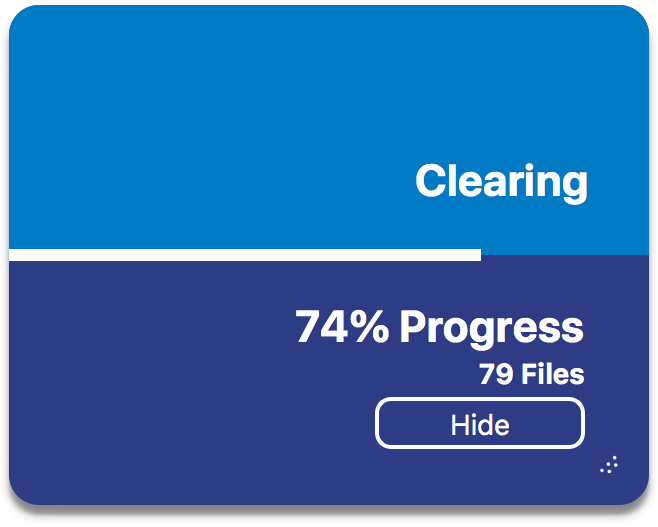
Interactions
- Clicking
Hidewill hide the dialog. You can display it again by clicking on the indexing progress bar in the status bar or refreshing.
Indexing Dialogs
This dialog shows the indexing progress of your project, by displaying the number of already indexed files, the last file that was started indexing, the number of errors and a progress estimate in percent.
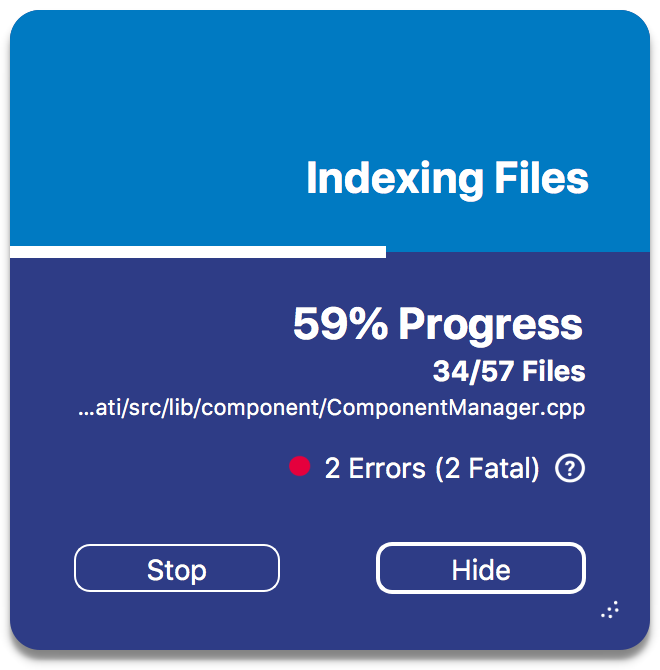
Interactions
- Clicking
Stopor pressing ESC will interrupt indexing. NumbatUI will still wait for the already running indexer threads to finish. You can continue indexing later by refreshing. - Clicking
Hidewill hide the dialog. You can display it again by clicking on the indexing progress bar in the status bar or refreshing.
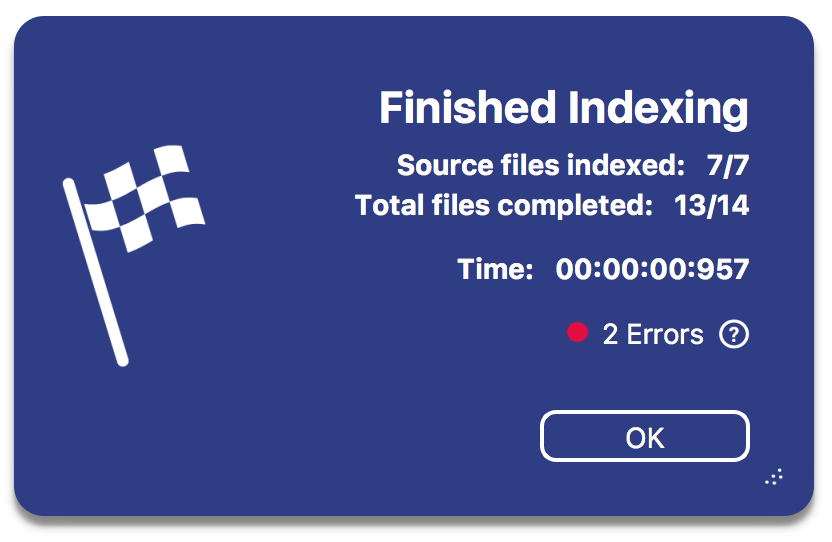
Finished Indexing Dialog
This dialog is shown after indexing finished, giving you information about indexed files, duration and errors.
Interrupted Indexing Dialog
This dialog is shown after indexing was stopped, giving you information about indexed files, duration and errors. You can choose to either use the new index or continue using the old one.
Interactions
- Clicking
Discardwill discard the new index. - Clicking
Keepwill switch your project to the new index and discard the old one.
Menu
Project
- New Project
- Shortcut: New Project
- Opens the New Project Dialog to define a new project and loads it after creation.
- Open Project
- Shortcut: Open Project
- Opens a file dialog to choose an existing NumbatUI project file from your system's hard drive.
- Recent Projects
- Opens a submenu to choose recent opened NumbatUI projects.
- Edit Project
- Opens the Edit Project Dialog prefilled with your project settings and allows for changing them.
- Exit
- Quits NumbatUI.
Edit
- Refresh
- Shortcut: Refresh
- Refresh will check all indexed source files for updates and reindex the ones that changed and their depending ones.
- Full Refresh
- Shortcut: Full Refresh
- Full Refresh will reindex the whole project.
- Find Symbol
- Shortcut: Find Symbol
- This option will put the focus into the search field, so you can start typing your search query. Alternatively you can click the search field.
- Find Text
- Shortcut: Find Text
- This option will put the focus into the search field and start a new full text search query
- Find On-Screen
- Shortcut: Find On-Screen
- Display the On-Screen Search Bar to search visible contents of the Graph View and Code View
- Next Reference
- Shortcut: Next Reference
- Use this option to iterate to the next source location of the active symbol in the code view.
- Previous Reference
- Shortcut: Previous Reference
- Use this option to iterate to the previous source location of the active symbol in the code view.
- Next Local Reference
- Shortcut: Next Local Reference
- Use this option to iterate to the next source location of the active local symbol or edge in the code view.
- Previous Local Reference
- Shortcut: Previous Local Reference
- Use this option to iterate to the previous source location of the active local symbol or edge in the code view.
- To overview
- Shortcut: To overview
- This option will display the overview of the project.
- Preferences
- Shortcut: Preferences
- Opens the Preferences Window.
View
- New Tab
- Opens a new tab.
- Close Tab
- Closes the current tab.
- Select Next Tab
- Switch to the tab to the right of the current tab.
- Select Previous Tab
- Switch to the tab to the left of the current tab.
- Show Start Window
- Shows the Start Window.
- Show Title Bars
- Toggle the visibility of the bars above each Window Widget.
- Reset window layout
- Resets all the dock widgets to their original layout.
- Search Window
- Toggle the visibility of the Search Window. This can also be done by closing the Search Window on clicking the "x" icon in it's title bar. (See Window Widgets)
- Graph Window
- Toggle the visibility of the Graph Window. This can also be done by closing the Graph Window on clicking the "x" icon in it's title bar. (See Window Widgets)
- Code Window
- Toggle the visibility of the Code Window. This can also be done by closing the Code Window on clicking the "x" icon in it's title bar. (See Window Widgets)
- Status Window
- Toggle the visibility of the Status Window. This can also be done by closing the Status Window on clicking the "x" icon in it's title bar. (See Window Widgets)
- Larger Font
- Shortcut: Larger Font
- Increase the font size within the Main Window's user interface.
- Smaller Font
- Shortcut: Smaller Font
- Decrease the font size within the Main Window's user interface.
- Reset font size
- Shortcut: Reset font size
- Resets the font size to the original size.
History
- Back
- Shortcut: Back
- Undoes the last navigation action.
- Forward
- Shortcut: Forward
- Redoes an undone navigation action.
- Recently Active Symbols
- List the history of active symbols in chronologic order.
Bookmarks
- Bookmark Active Symbol
- Shortcut: Bookmark Active Symbol](#shortcuts)
- Opens the Bookmark Creator dialog create a new bookmark.
- Bookmark Manager
- Shortcut: Bookmark Manager](#shortcuts)
- Opens the Bookmark Manager dialog for viewing all bookmarks.
- Recent Bookmarks
- List of recently added bookmarks for quick activation.
Help
- About
- Shows copyright information about NumbatUI.
- Keyboard Shortcuts
- Shows table of keyboard shortcuts for NumbatUI.
- Documentation
- Opens this documentation of NumbatUI in your web browser by URL.
- Changelog
- Opens the changelog of NumbatUI in your web browser by URL.
- Bug Tracker
- Opens NumbatUI's bug tracker in your web browser by URL.
- License
- Opens a window containing the NumbatUI license and all 3rd party licenses.
- Show Data Folder
- Opens the file explorer showing the data folder.
- Show Log Folder
- Opens the file explorer in the directory data/logs where all log files are saved to. You can enable file logging in the Preferences Window.
Shortcuts
General
| Shortcut | Windows | macOS | Linux |
|---|---|---|---|
| Switch Focus Between Graph/Code Views | Tab |
Tab |
Tab |
| Preferences | Ctrl + , |
Cmd + , |
Ctrl + , |
| New Project | Ctrl + N |
Cmd + N |
Ctrl + N |
| Open Project | Ctrl + O |
Cmd + O |
Ctrl + O |
| Close Window | Alt + F4 |
Cmd + W |
Ctrl + W |
| Hide Window | Cmd + H |
||
| Refresh | F5 |
Cmd + R |
F5 |
| Full Refresh | Shift + F5 |
Cmd + Shift + R |
Shift + F5 |
| Back | Z / Alt + Left / Backspace |
Z / Cmd + [ / Backspace |
Z / Alt + Left / Backspace |
| Forward | Shift + Z / Alt + Right |
Shift + Z / Cmd + ] |
Shift + Z / Alt + Right |
| Find Symbol | Ctrl + F |
Cmd + F |
Ctrl + F |
| Find Text | Ctrl + Shift + F |
Cmd + Shift + F |
Ctrl + Shift + F |
| Find On-Screen | Ctrl + D |
Cmd + D |
Ctrl + D |
| To overview | Ctrl + Home |
Cmd + Home / Cmd + Up |
Ctrl + Home |
| New Tab | Ctrl + T |
Cmd + T |
Ctrl + T |
| Close Tab | Ctrl + W |
Cmd + W |
Ctrl + W |
| Select Next Tab | Ctrl + Tab |
Ctrl + Tab |
Ctrl + Tab |
| Select Previous Tab | Ctrl + Shift + Tab |
Ctrl + Shift + Tab |
Ctrl + Shift + Tab |
| Larger Font | Ctrl + + |
Cmd + + |
Ctrl + + |
| Smaller Font | Ctrl + - |
Cmd + - |
Ctrl + - |
| Reset Font Size | Ctrl + 0 |
Cmd + 0 |
Ctrl + 0 |
| Bookmark Active Symbol | Ctrl + S |
Cmd + S |
Ctrl + S |
| Bookmark Manager | Ctrl + B |
Cmd + B |
Ctrl + B |
Graph View
| Shortcut | Windows | macOS | Linux |
|---|---|---|---|
| Move Focus Within Nodes | WASD / HJKL / Arrows |
WASD / HJKL / Arrows |
WASD / HJKL / Arrows |
| Move Focus Within Edges | Shift + WASD / Shift + HJKL / Shift + Arrows |
Shift + WASD / Shift + HJKL / Shift + Arrows |
Shift + WASD / Shift + HJKL / Shift + Arrows |
| Activate Node/Edge | Enter / E |
Enter / E |
Enter / E |
| Activate Node in New Tab | Ctrl + Shift + Enter / Ctrl + Shift + E |
Cmd + Shift + Enter / Cmd + Shift + E |
Ctrl + Shift + Enter / Ctrl + Shift + E |
| Expand/Collapse Node | Shift + Enter / Shift + E |
Shift + Enter / Shift + E |
Shift + Enter / Shift + E |
| Pan | Ctrl + Arrows |
Cmd + Arrows |
Ctrl + Arrows |
| Zoom In | Ctrl + Shift + Up / Ctrl + Mouse Wheel Up |
Cmd + Shift + Up / Cmd + Mouse Wheel Up |
Ctrl + Shift + Up / Ctrl + Mouse Wheel Up |
| Zoom Out | Ctrl + Shift + Down / Ctrl + Mouse Wheel Down |
Cmd + Shift + Down / Cmd + Mouse Wheel Down |
Ctrl + Shift + Down / Ctrl + Mouse Wheel Down |
| Reset Zoom | 0 |
0 |
0 |
| Open Custom Trail Dialog | Ctrl + U |
Cmd + U |
Ctrl + U |
Code View
| Shortcut | Windows | macOS | Linux |
|---|---|---|---|
| Next Reference | Ctrl + G |
Cmd + G |
Ctrl + G |
| Previous Reference | Ctrl + Shift + G |
Cmd + Shift + G |
Ctrl + Shift + G |
| Next Local Reference | Ctrl + T |
Cmd + T |
Ctrl + T |
| Previous Local Reference | Ctrl + Shift + T |
Cmd + Shift + T |
Ctrl + Shift + T |
| Move Focus Within Code | WASD / HJKL / Arrows |
WASD / HJKL / Arrows |
WASD / HJKL / Arrows |
| Move Focus to Closest Reference | Shift + WASD / Shift + HJKL / Shift + Arrows |
Shift + WASD / Shift + HJKL / Shift + Arrows |
Shift + WASD / Shift + HJKL / Shift + Arrows |
| Activate Location | Enter / E |
Enter / E |
Enter / E |
| Activate Location in New Tab | Ctrl + Shift + Enter / Ctrl + Shift + E |
Cmd + Shift + Enter / Cmd + Shift + E |
Ctrl + Shift + Enter / Ctrl + Shift + E |
| Scroll | Ctrl + Arrows |
Cmd + Arrows |
Ctrl + Arrows |
Graph View
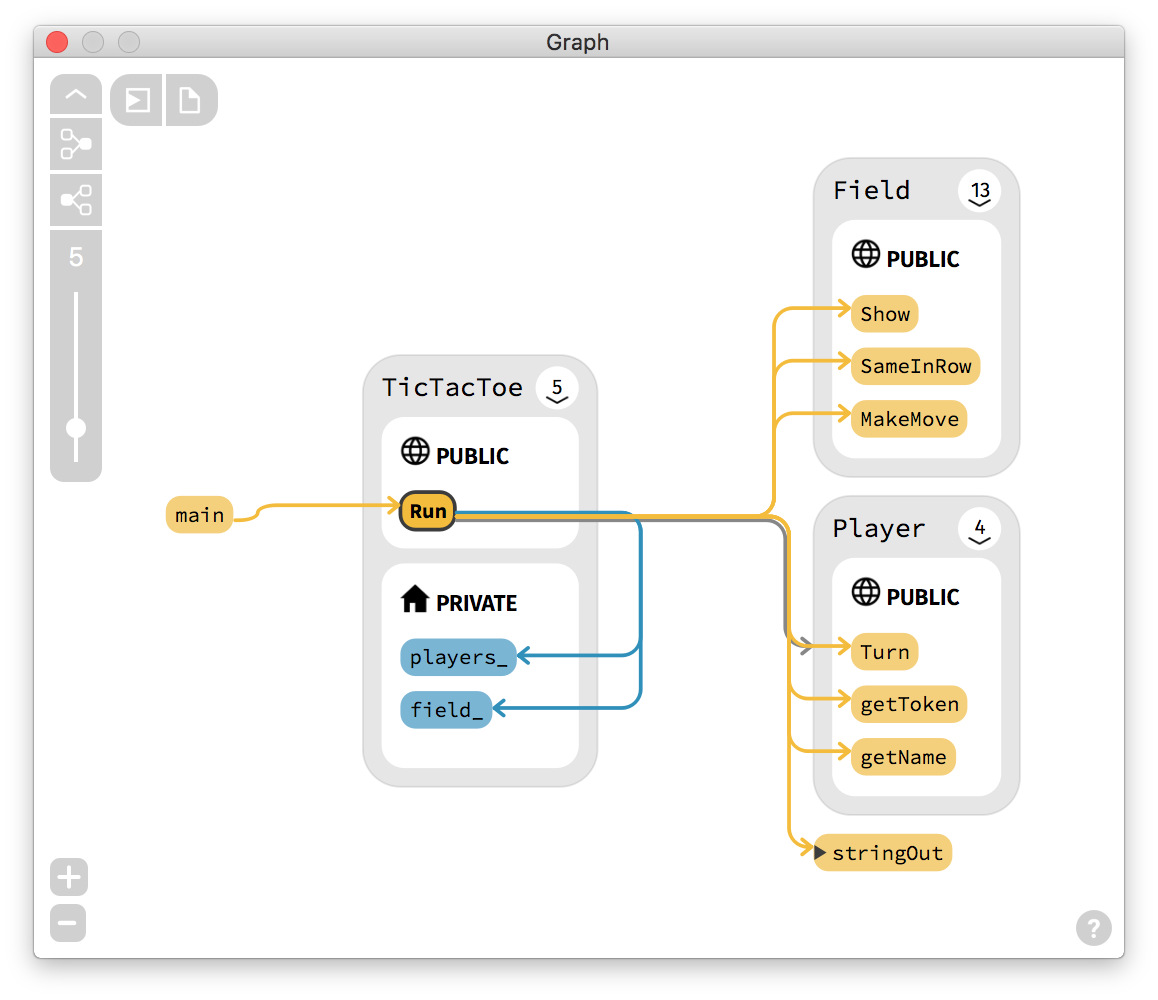
The graph view visualizes the currently selected symbol and all its relationships to other symbols as an interactive graph visualization. You can also display whole call graphs, inheritance chains or include trees by using the toolbar in the top left. Read more about that at Custom Trail.
Interactions:
Buttons:
- Use the trail navigation in the top left to create Custom Trails.
- Use the grouping buttons in the top left to enable Node Grouping by namespace/package or file.
- Press the
+and-buttons in the lower left corner to change the zoom level. - Press the
?button in the bottom right corner to show the Graph Legend.
Panning:
- Drag the background area with the mouse.
- Scroll left-right and up-down on the mouse pad.
- Use the keys
WASD.
Zooming:
- Hold
Ctrl/Cmdand scroll with mouse wheel or mouse pad. - Press
Shift + WorShift + S. - Press
0to reset zoom.
Context Menu:
- Open in New Tab: Opens a new Tab with the node under the mouse cursor as active symbol.
- Back: Go back in history.
- Forward: Go forward in history.
- Show Definition: Show the definition of the node under the mouse cursor in the Code View.
- Expand Node: Expand node under mouse cursor.
- Collapse Node: Collapse node under mouse cursor.
- Hide Node: Hide node under mouse cursor.
- Hide Edge: Hide edge under mouse cursor.
- Bookmark Node: Create a bookmark for node under mouse cursor.
- Save As Image: Export current graph as image file. Possible formats are
PNG,JPEG,BMPandSVG. - Save To Clipboard: Save current graph as
PNGimage to clipboard. - Copy Name: Copy name for node under mouse cursor to clipboard.
- Copy Full Path: Copy file path for file node under mouse cursor to clipboard.
- Open Containing Folder: Show the file in your file explorer for file node under mouse cursor.
Nodes
Colors are corresponding to the default color scheme.
| Node Type | Image |
|---|---|
| File: Non-indexed files are files that are not part of any source group and therefore have not been indexed by NumbatUI's indexer. Incomplete files produced errors during indexing or where part of an indexer run with errors. |  |
| Macro |  |
| Namespace, Package & Module |  |
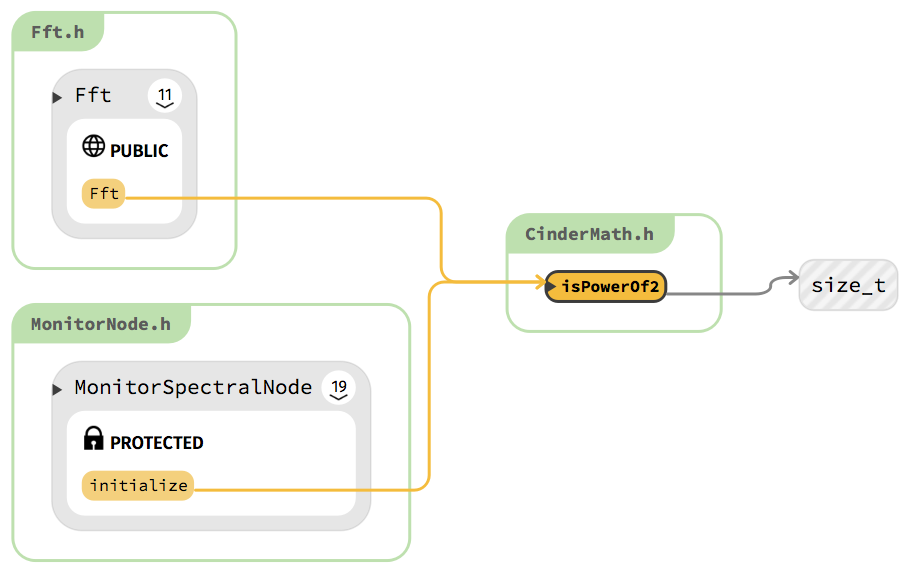
| Class & Struct: Display their members nested, and separated by access type: public, protected, private. By default only members with edges are shown. The arrow icon allows to expand and collapse them. The number tells how many nodes are hidden. |  |
| Type |  |
| Typedef |  |
| Variable & Field |  |
| Function & Method |  |
| Enum & Enum Constant |  |
| Bundle: A bundle node combines multiple nodes to reduce the size of the graph visualization. The name describes what kind of nodes are bundled. The number tells how many nodes are bundled. |  |
| **Group: A group node shows that all contained nodes share something in common e.g. same file or namespace. |  |
Interactions
- Click a node to activate it.
- Drag a node to change its position.
- Click the arrow icon in class nodes to expand and collapse it.
- Click a bundle node to expand it.
- Hover a node to see a tooltip that displays the node’s type.
Edges
Colors are corresponding to the default color scheme.
| Edge Type | Image |
|---|---|
| File Include |  |
| Type Use |  |
| Variable Use |  |
| Function Call |  |
| Inheritance |  |
| Method Override |  |
| Template Specialization & Template Argument Use |  |
| Template Member Specialization |  |
| Bundled Edges: Bundles multiple edges between the child nodes of the 2 nodes. The thickness gives an impression of how many edges are bundled. Hover the edge to get the number of bundled edges. |  |
Interactions
- Click an edge to see its location in the Code View.
- Click a bundled edges to activate all its corresponding edges.
- Hover an edge to see a tooltip that displays the edge’s type.
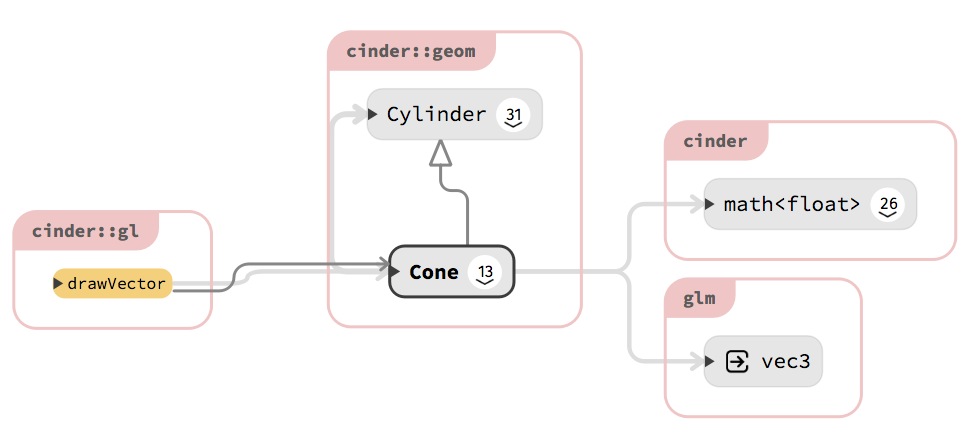
Custom Trail
Using the toolbar in the top left you can display whole call graphs, inheritance chains or include trees for the currently active symbol if the right symbol type is currently active. Or you can use the Custom Trail Dialog to display graphs based on custom criteria.

Interactions
- Click the arrow button to expand/collapse the
Custom Trailcontrols. - Click the
Custom Trail Dialogbutton to show theCustom Trail Dialog. - Click the
Predefined Custom Trailbuttons to show a graph of depending/dependent nodes based on the currently active symbol. - Change the slider position to change the maximum depth of the graph. Moving it to the top will use infinite depth.
- Click on a node to activate it.
- Click on an edge to show it's source location in the Code View.
Custom Trail Dialog
The Custom Trail Dialog can be accessed within the trail controls in the top left of the graph view. It allows to display Custom Trails based on certain criteria.
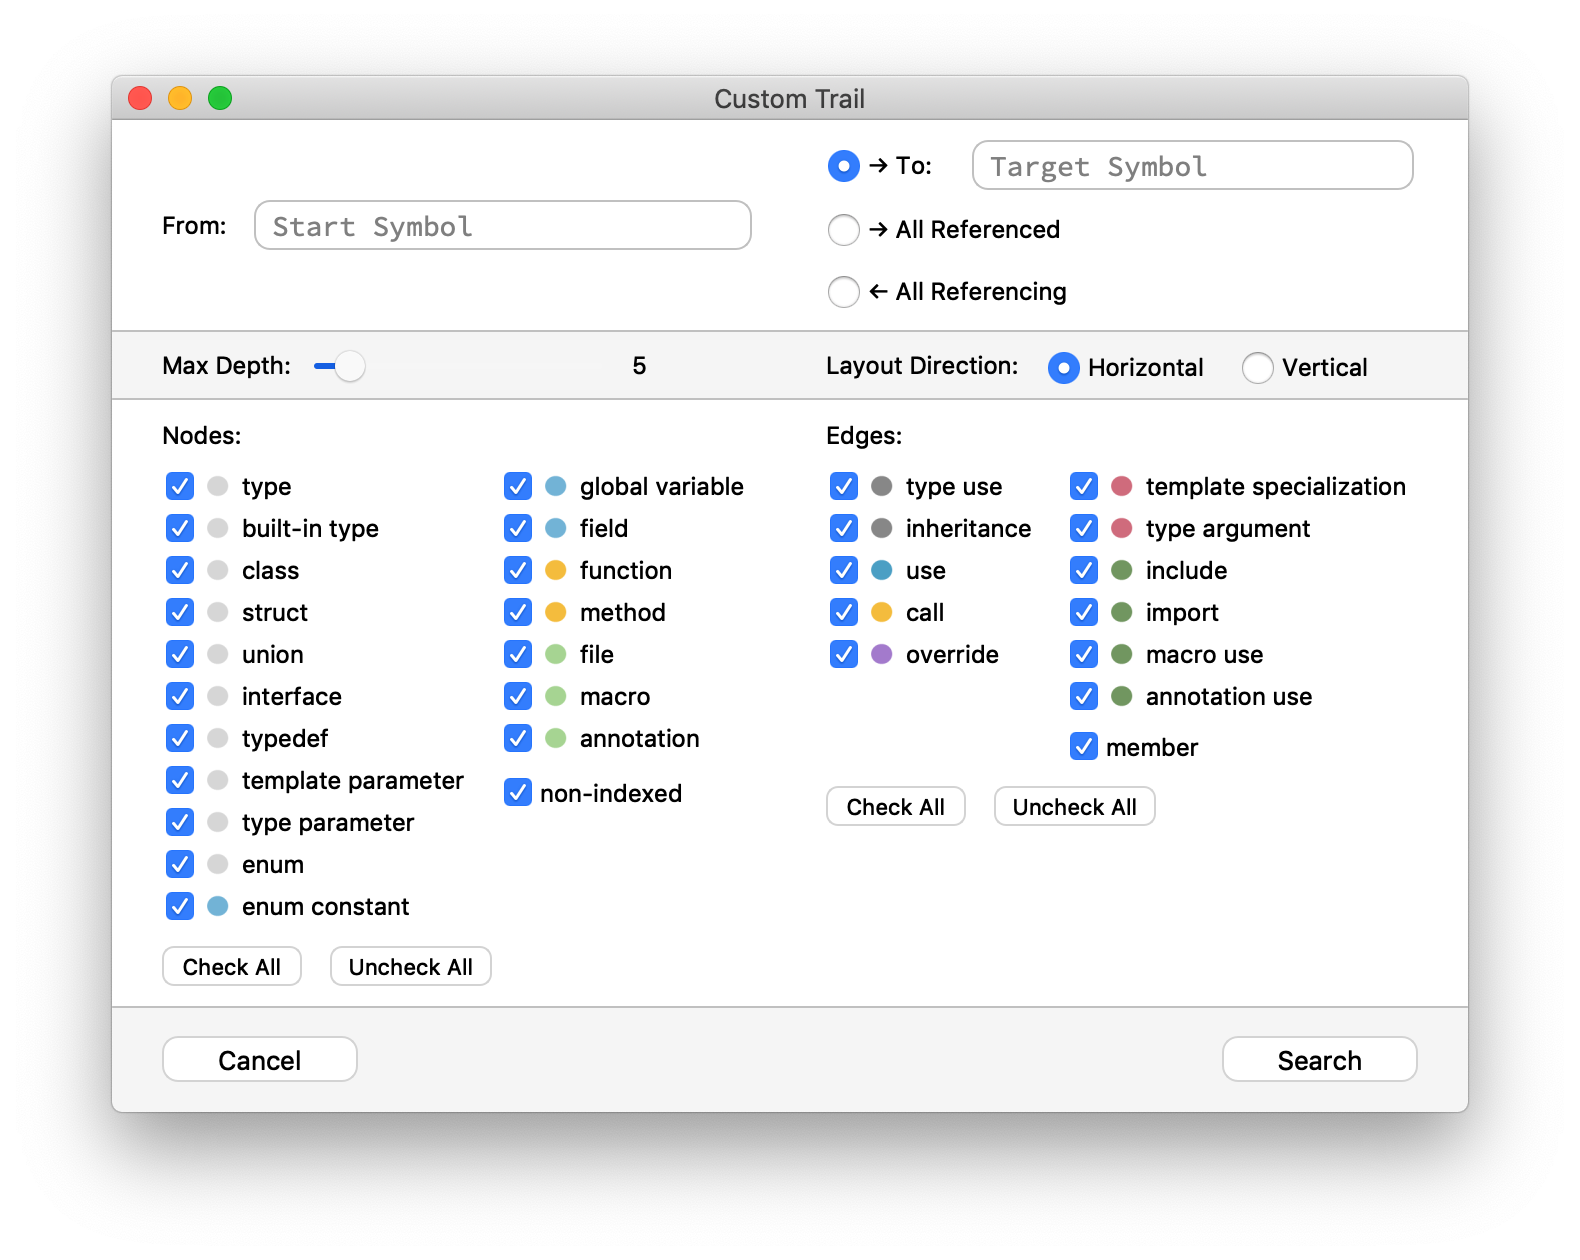
Every Custom Trail has a specific Start Symbol, then 1 of 3 different modes can be chosen:
| Mode | Description |
|---|---|
| To Target Symbol | Specify another target symbol. The graph will only contain paths from the origin to the target symbol. |
| All Referenced | The graph will only contain nodes that are referenced by the origin symbol. |
| All Referencing | The graph will only contain nodes that depend on the origin symbol. |
Additional options allow defining which information should be shown:
| Setting | Description |
|---|---|
| Maximum Depth | Define the depth of the resulting graph. When searching paths from origin to target, all paths that are beyond this depth will not be found. |
| Layout Direction | Define if the graph should be displayed vertically or horizontally. |
| Node Filters | Define which node types will be part of the resulting graph. Only node types present in the loaded project are displayed. This setting is ignored for the origin and target nodes. |
| Edge Filters | Define which edge types will be part of the resulting graph. Only node types present in the loaded project are displayed. The special edge "member" defines whether parent-child relations are considered as edge. |
Interactions
- Search for start and target symbols using a search field. The interactions are the same as in the main Search Field.
- Drag the Max Depth slider to change the maximum depth of the resulting graph.
- Click the Check All and Uncheck All buttons to check all available node or edge filters.
- Click on Cancel to close the dialog.
- Click on Search to search for a Custom Trail using the selected options.
Node Grouping
Using grouping buttons in the top left you can specify if nodes in the graph shall be grouped by either namespace/package or defining file.

Namespace/Package Grouping
All nodes that belong to the same namespace or package are grouped together in a separate group node.
File Grouping
All nodes defined in the same source or header file are grouped together in a separate group node.
Interactions
- Click on the group name to activate the corresponding namespace/package or file node.
Graph Legend
Click the ? button in the bottom right corner of the graph view or enter the keyword legend in the search field to show the graph legend. It gives you an overview on the different node and edge types and provides examples of graph layouts.

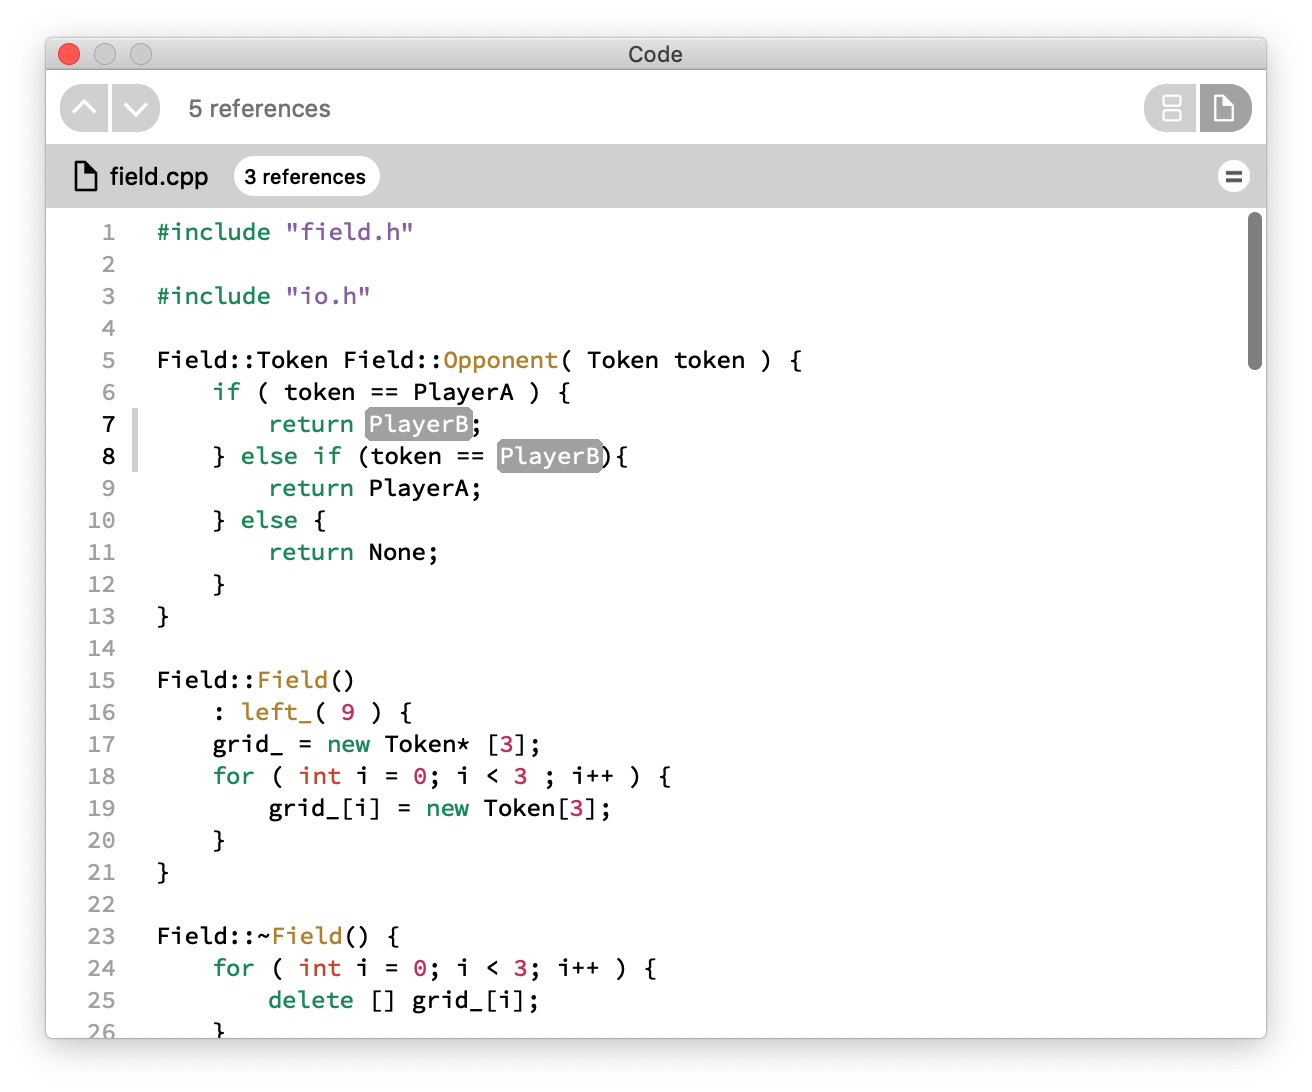
Code View
The code view displays the corresponding source code of the currently selected symbols. The code view has two modes. In list mode it contains a list of one or more files. In single file mode it shows one full source file at a time.
Interactions
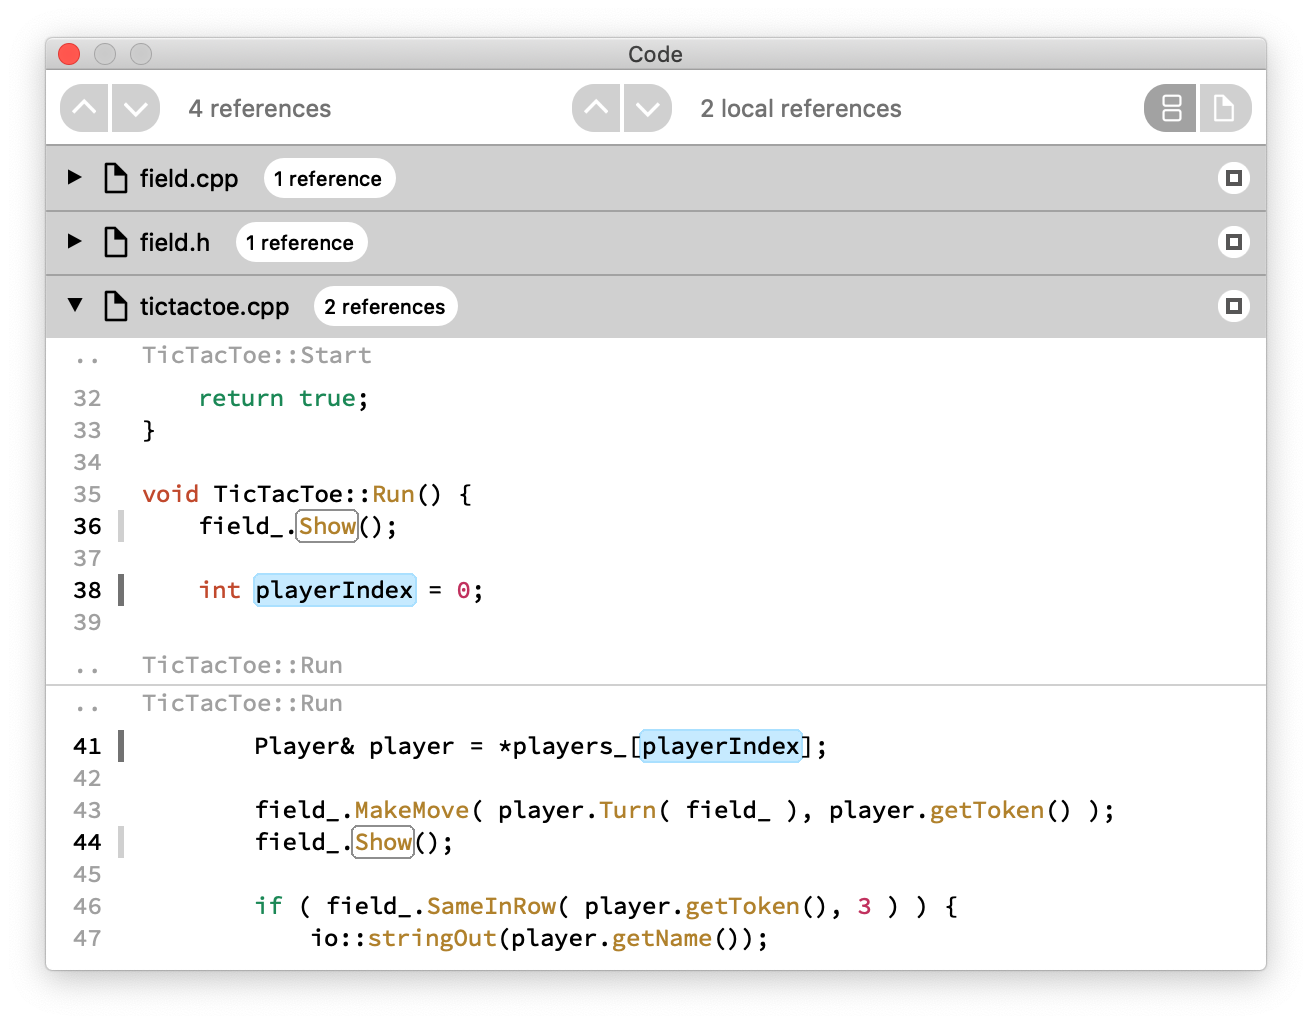
- Iterate the references of the currently active symbol with the
referencenavigation in the upper left corner. - Iterate local references of the currently selected local variable or multiple references of a symbol within a local scope with the
local referencenavigation in center. - Switch between Snippet List and Single File mode with the
mode selectionin the upper right corner. - Scroll up and down to see the different source files.
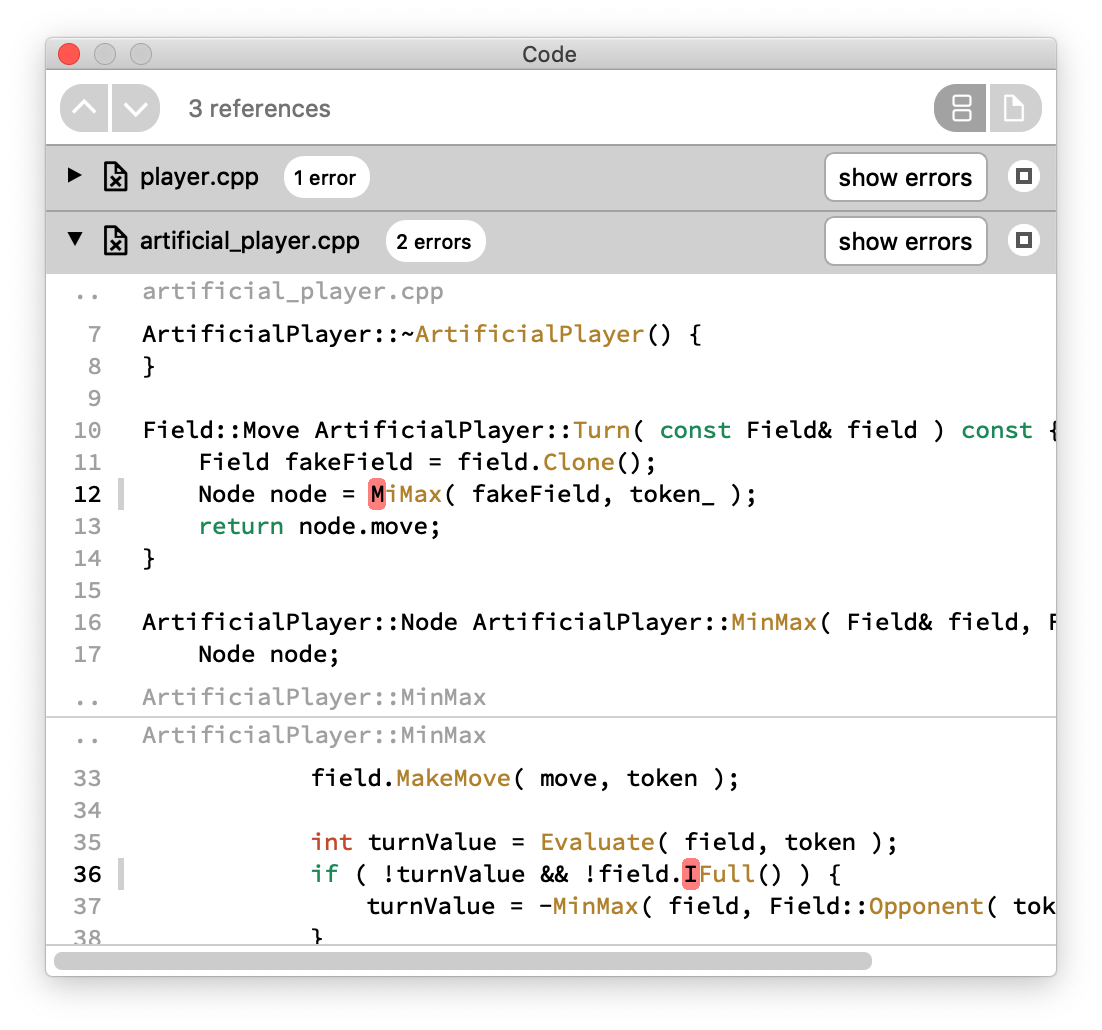
If a viewed file had errors during indexing, its file icon will contain an x and there is a Show Errors-button visible in the files title bar. Clicking one Show Errors will show you only the errors that cause this specific file to be incomplete in the Errors Tab.
Snippet List Mode
In this mode the Code View will provide all references of the currently active symbol at once. The top most snippet will show the definition of the symbol if available.
Files
Each file has a title bar with the file's name. Clicking the title bar will change the display state. There are 2 different states:
- Minimized: The file does not show its content.

- Snippets: The file displays the snippets containing active locations separated by lines.
Interactions
- Hover the title to see the full file path.
- Click the title to activate the file's corresponding node and switch to full file view.
- Click the title bar to minimize the file or show its snippets.
- Click the snippet button to switch to snippet or full file view, depending on the file node
- Click the maximize button to switch to Single File Mode.
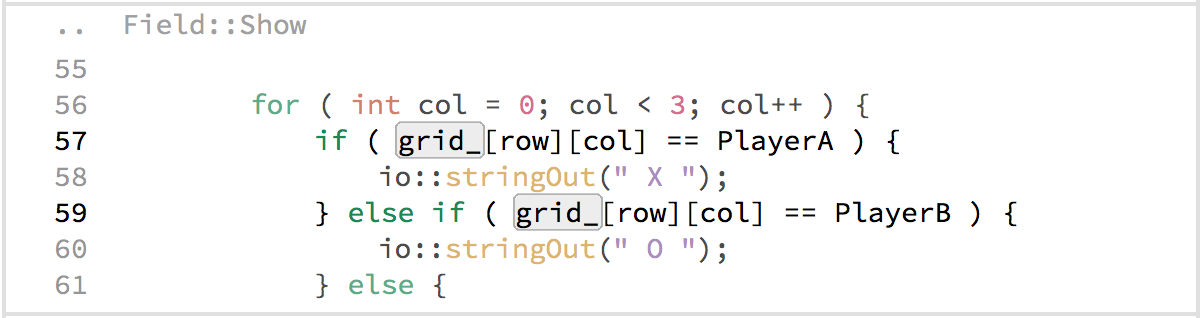
Snippets
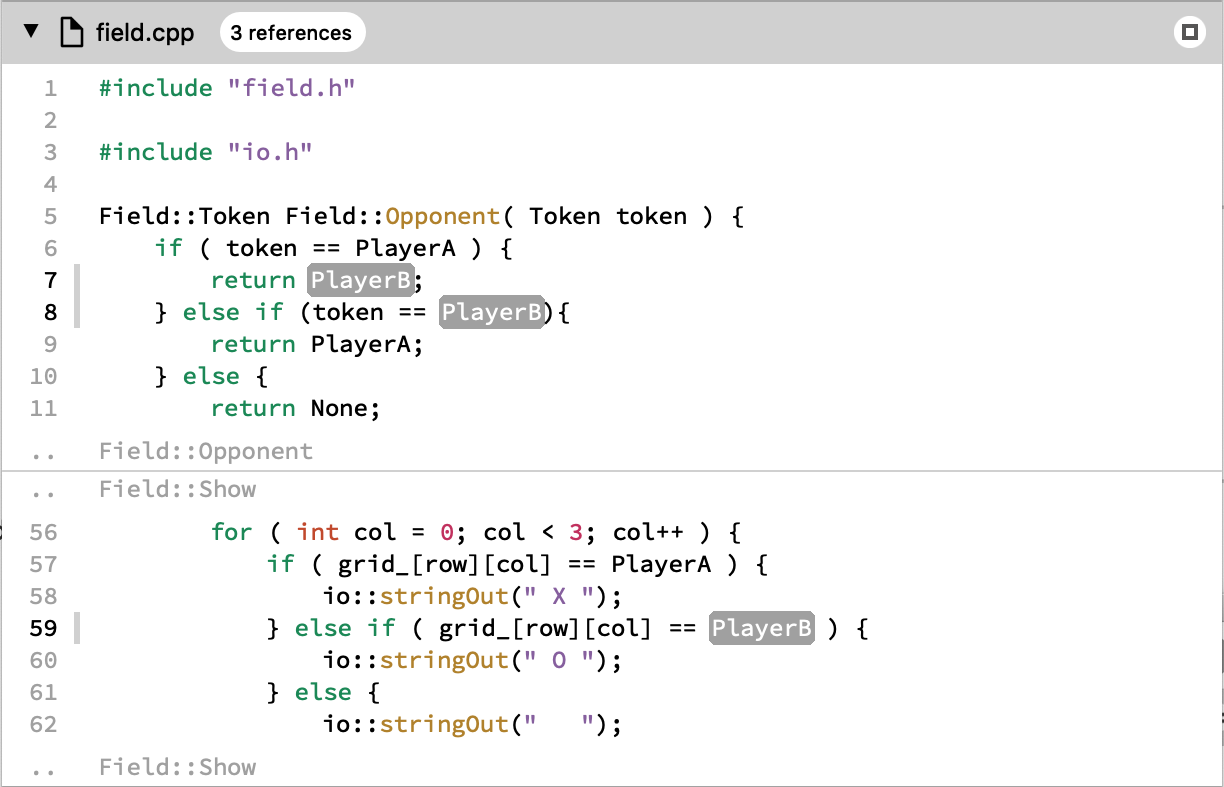
A code snippet contains the lines of interest for the currently active symbol surrounded by some more lines to provide some context. Other symbols that were indexed by NumbatUI are framed by a box when hovered. Here NumbatUI distinguishes between local symbols and symbols that can be related to any other part of the code base. In case the snippet is part of a class, function or namespace, an additional line at the top of the snippet provides information about the snippet’s context (e.g. the surrounding scope).
Interactions
- Click the top line to show the whole scope around the snippet.
- Click a boxed symbol to activate it.
- Click a boxed local symbol to highlight all its usages in the visible code.
Single File Mode
In single file mode you will only every have one file visible at a time. The first file shown is usually the file containing the definition of the active snippet if available. Other than that the user interface is the same as in Snippet List Mode.
Interactions
- Hover the title to see the full file path.
- Click the title to activate the file's corresponding node.
- Click the snippet button to switch to Snippet List Mode.
Search View
The Search View contains the search field and some other related user interface elements.
Back, Forward and History
The left Backward button lets you undo your last navigation actions (see Back) and the right Forward button lets you redo your undone navigation actions again (see Forward). Both buttons are only enabled when the respective actions are available at the moment.
The middle button shows a list of the recently active symbol stack. Select a symbol to activate it.


Interactions
- Hover the buttons to see a tool tip.
- Press the buttons to execute the respective action.
- Press the history button to show the active symbol stack and click on an item to activate it.
Refresh
The refresh button allows you to refresh the current project and reindex all updated, added and removed files. To reindex the whole project choose the Force Refresh option from the Edit Menu.

Interactions
- Hover the buttons to see a tooltip.
- Press the refresh button to refresh the project.
Overview Button
Show the overview screen, which gives a summary of the loaded project. The overview screen is shown after the project was loaded. Alternatively use the shortcut To overview.

Interactions
- Press the overview button to show the project overview.
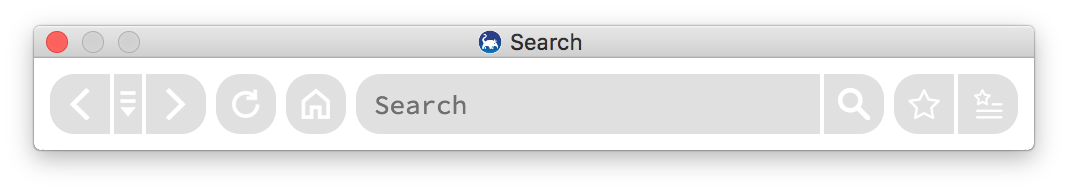
Search Bar
The search bar allows you to enter search requests to find one of NumbatUI's indexed symbols. It doesn't allow for full text searching across all files so far. The search field allows for most text editing interactions common to text fields. When typing your request the Autocompletion Popup will show you search results matching to your entered string.

Interactions
- Focus the search field by clicking it or using the Find Symbol action.
- Enter your search request by typing on your keyboard.
- By pressing enter or clicking on the search icon on the right you send your request.
- The search field allows for most interactions known from other text fields such as moving the cursor, copy&paste and text selection.
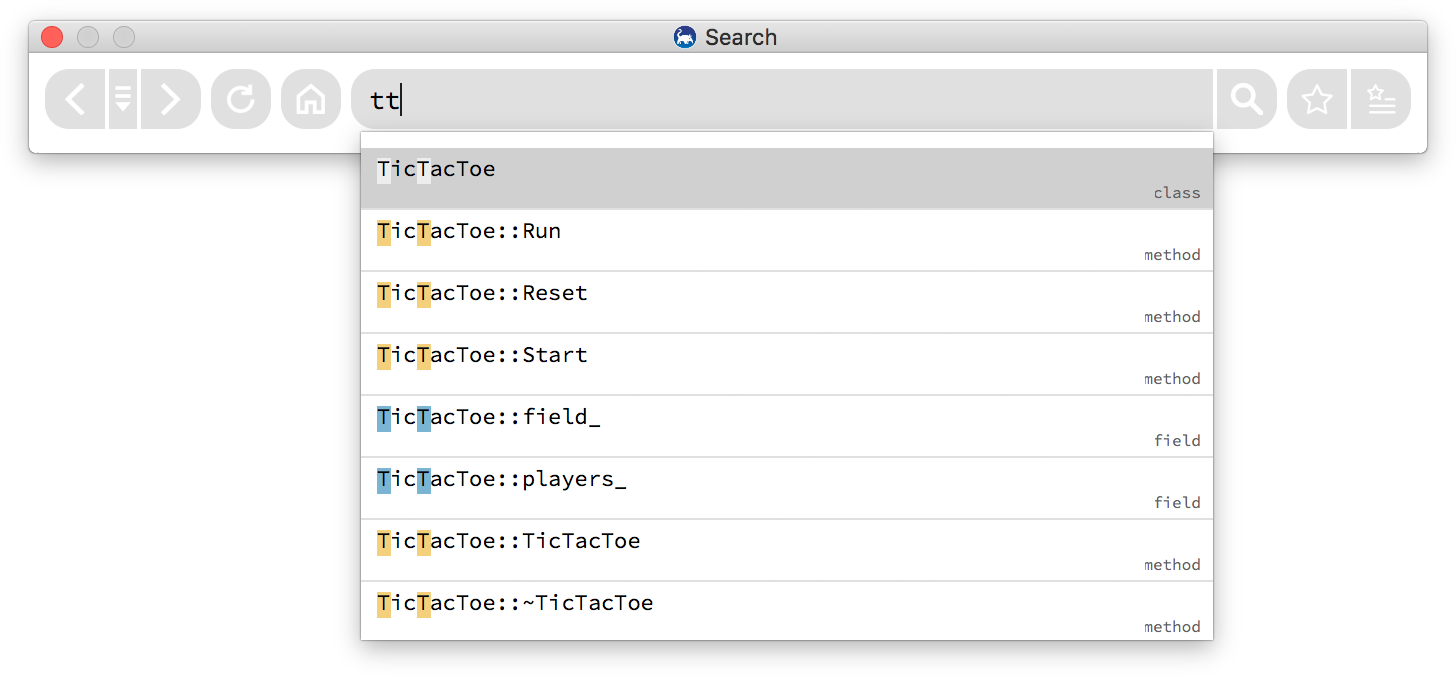
Autocompletion Popup
The Autocompletion Popup displays all Nodes matching your search request within all indexed symbols. The match results are determined by a fuzzy matching algorithm, that allows you to skip characters. The popup shows which characters in the words are matching and displays their corresponding node color. The node type is displayed on the right.
Interactions
- Use the up and down arrow keys to switch between search results.
- Pressing tab or clicking on the search result will insert it into the search field.
- Pressing enter will select the search result and send the search request.
Keywords
Additionally the search view provides specific keywords that select a certain group of symbols.
| keyword | effect |
|---|---|
| overview | Shows an overview of all indexed symbols in the graph view and some statistics in the code view. |
| error | Shows all errors in the code view. |
Full text search
Search for a certain string in all indexed files by putting ? at the front of your search query. The default full text search is case-insensitive, use ?? to search case-sensitive.

Interactions
- Start a query with
?or use the Find Text action to do a case-insensitive full text search. - Start a query with
??to do a case-sensitive full text search.
Bookmarking Buttons
The Bookmark Active Symbol button on the left opens the Bookmark Creator to create a new bookmark. The Bookmark Manager button on the right is used to display the Bookmark Manager for activating and editing your bookmarks.

Interactions
- Hover the buttons to see a tool tip.
- Press the buttons to execute the respective action.
Bookmark Creator
Use the Bookmark Creator to create or edit bookmarks.
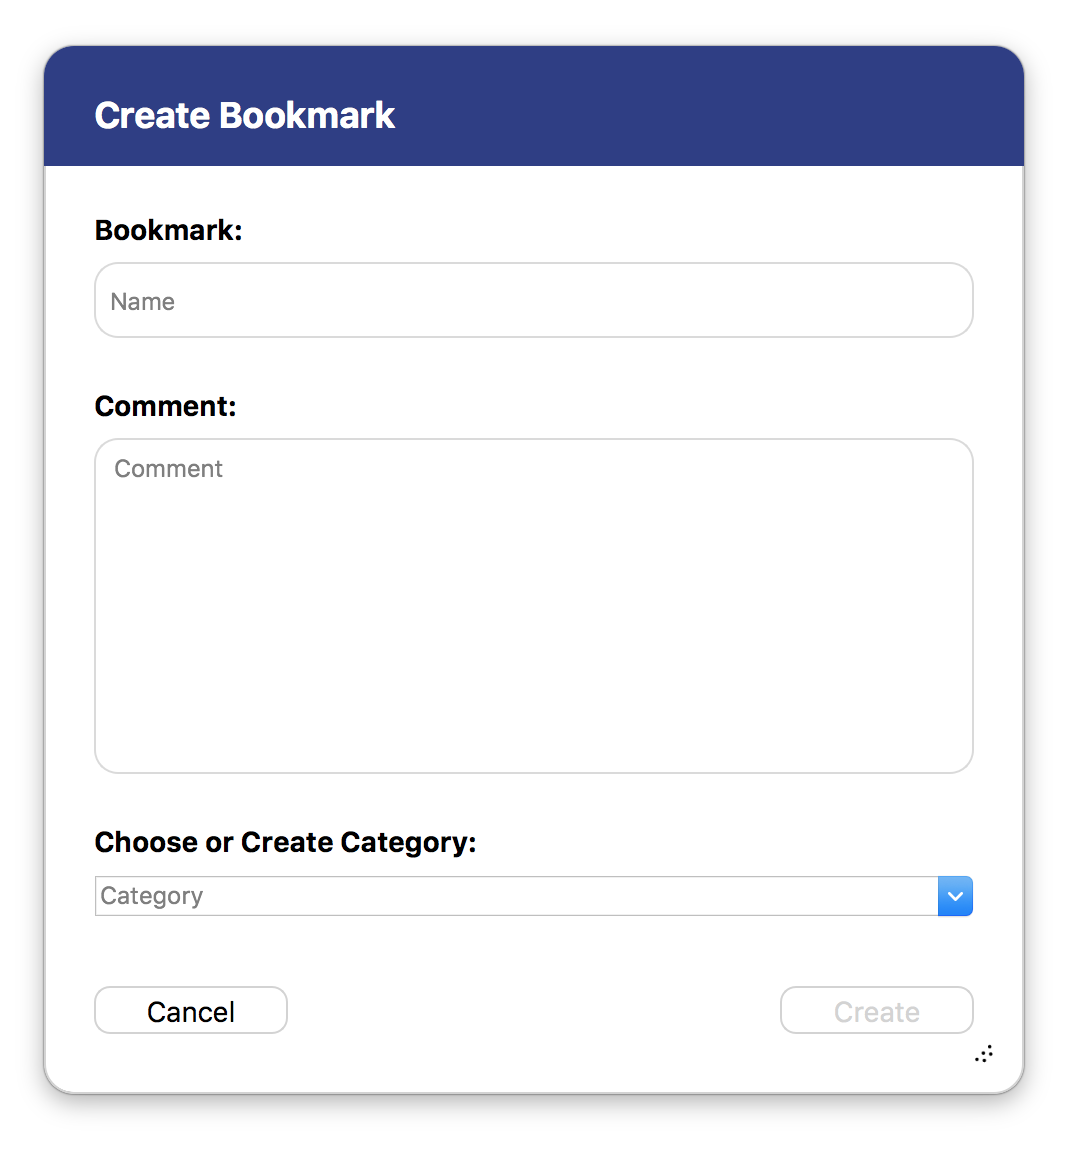
| Setting | Description |
|---|---|
| Name | The name of the bookmark. Initially the name of the node or edge is used. |
| Comment | Add an optional comment to the bookmark. |
| Category | Add the bookmark to a certain category. Bookmarks with the same category are grouped together in the Bookmark Manager. |
Interactions
- Press
Cancelto close without changes. - Press
Create/Saveto save the bookmark or apply the changes.
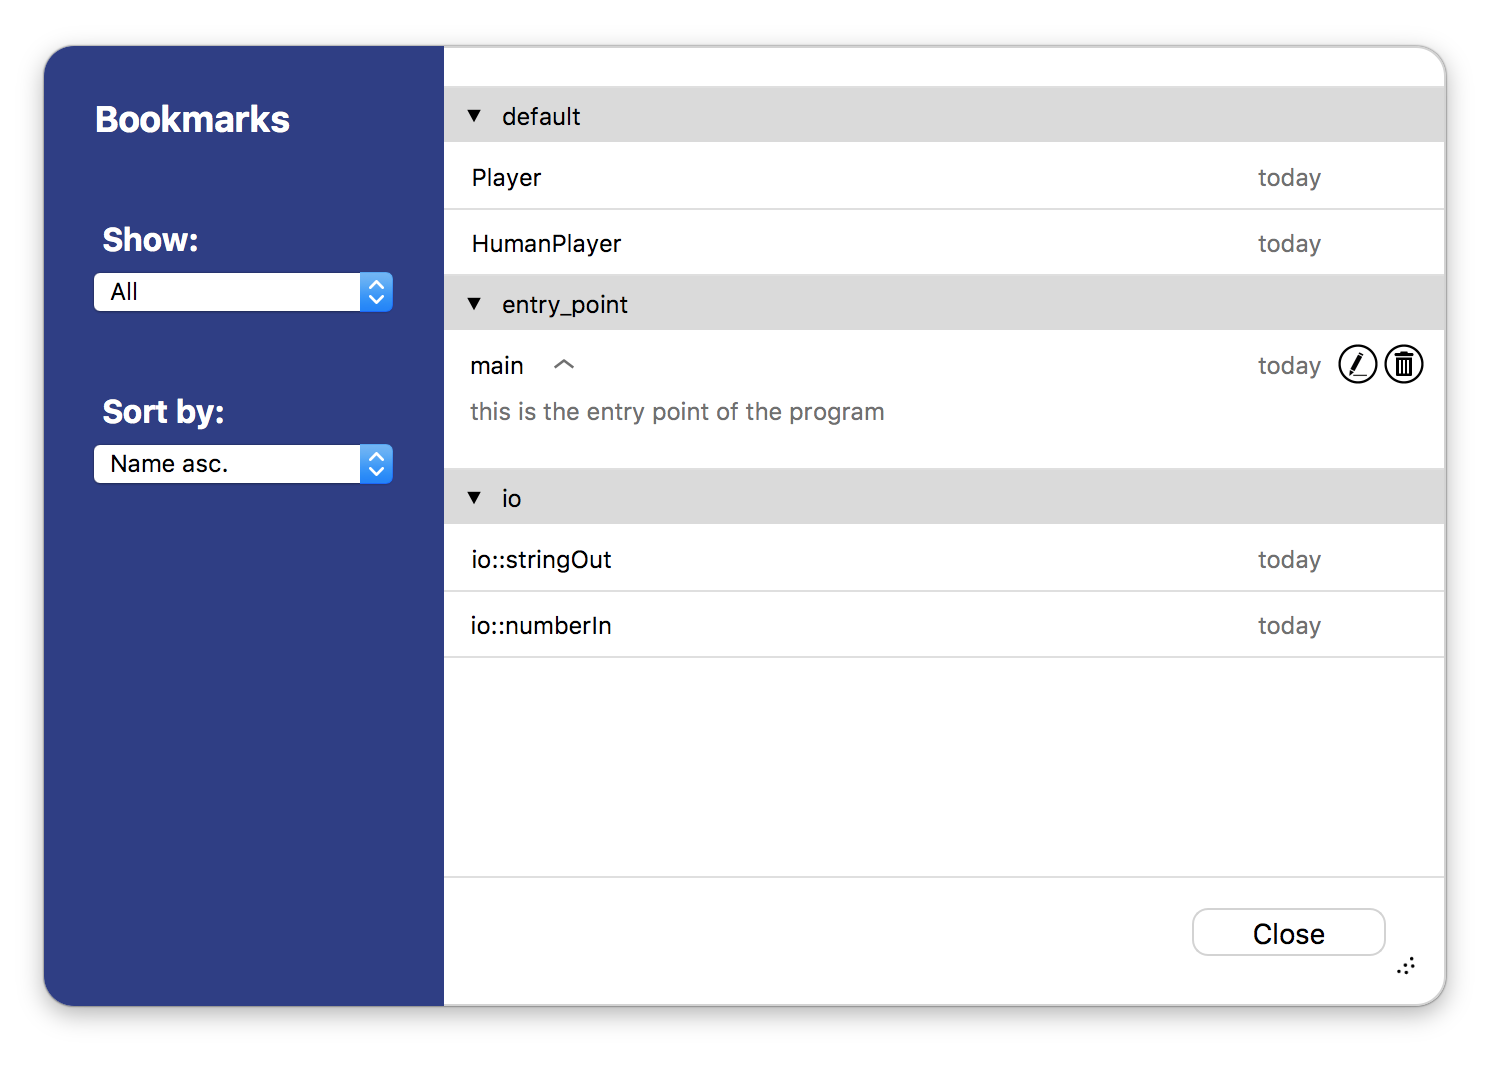
Bookmark Manager
Use the Bookmark Manager to view and activate your bookmarks. Bookmarks are displayed as lines below their respective category. If a bookmark does not have a category it will be placed within the default category. The buttons for removing/editing categories or bookmarks are only visible when hovering the respective line. Bookmark information is stored within a separate .srctrlbm file next to your .srctrlprj project file.
Interactions
- Activate bookmarks by clicking on the name.
- Open/Collapse the bookmark comment by clicking within the bookmark line.
- Click the
Editbutton to change the contents of the bookmark. - Click the
Deletebutton at a bookmark to remove the bookmark. - Open/Collapse categories by clicking in their line.
- Click the
Deletebutton at a category to remove the category and all bookmarks within. - Change the
Showfilter to switch between display of nodes and/or edges. - Change the
Sortingto change the order of bookmarks within their categories.
Status View
This view provides different tabs with information about your project. This view is hidden by default.
!!! abstract "Interactions"
- Click on the titles on top to switch between tabs.
- Click on the
x-button in the top right corner to close the Status View.
Status Tab
This table gives some information about status updates while running NumbatUI. It can be helpful to figure out why something does not the way it's expected to.

Interactions
- Double click on a table cell to select the text for copy&paste.
- Use the checkboxes below to filter the shown messages by type.
- Click on
Clear Tableto remove all rows from the table.
Errors Tab
This list shows errors occurred during indexing.

The following information is provided:
- Type: ERROR or FATAL. A FATAL error causes lots of missing information since the indexer had to stop at this error.
- Error message
- File
- Line number
- Indexed: Whether the file is within the indexed files.
- Translation Unit: The source file that produced this error while being indexed.
Interactions
- Click on a error line to see the location of the error in the Code View.
- Click on the column headers to sort the error rows ascending or descending by this data.
- Double click on a table cell to select the text for copy&paste.
- Use the checkboxes below to filter the shown errors by certain criteria.
- Click on
Edit Projectto open the Edit Project Dialog.
Tooltips
Show information about hovered symbols in the Graph View and Code View
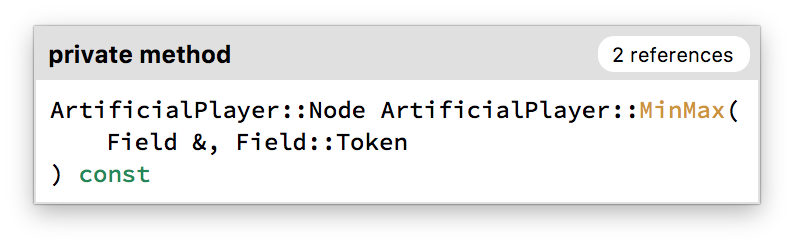
The following information is provided:
- Symbol type
- Visibility (e.g. public or private)
- Reference count
- Symbol name
- Clickable type name for global variables and fields.
- Full signatures with clickable return type name and parameter types names for functions and methods.
Interactions
- Click on symbol names to activate them.